Technical analysis is a method of evaluating securities by analyzing statistics generated by market activity, such as past prices and volume. Technical analysts use this information to identify trends and make trading decisions. One of the key tools used in technical analysis is chart patterns. Head and shoulders pattern formation is one such pattern that technical analysts use to identify potential trading opportunities.
Understanding Head and Shoulders Pattern Formation
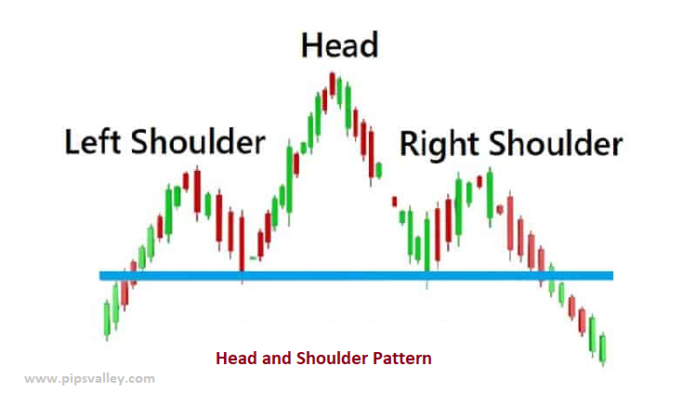
A head and shoulders pattern formation is a technical analysis pattern that occurs when a security’s price rises to a peak, drops back to a trough, rises again to a higher peak, drops again to a higher trough, and then rises again but only to the level of the second peak. The pattern resembles a head with two shoulders on either side, hence the name.
There are three key characteristics that technical analysts look for when identifying a head and shoulders pattern formation:
- The first peak represents the left shoulder.
- The second peak represents the head, which is the highest point in the pattern.
- The third peak represents the right shoulder.
The neckline is another important component of the pattern. It is a trend line that connects the lowest points of the two troughs in the pattern. Once the neckline is broken, it is considered a signal that the pattern has been confirmed.
Volume is also an important consideration in this type of pattern formation. Generally, volume should be highest during the formation of the left shoulder and lower during the formation of the head. Volume should then increase again during the formation of the right shoulder.
Trading Strategies for Head and Shoulders Pattern Formation
This pattern formation is often seen as a bearish signal. Technical analysts will often look to take short positions when they identify the pattern. A common strategy is to enter a short position once the price breaks through the neckline. The profit target for the trade is often set at a distance equal to the height of the pattern measured from the top of the head to the neckline.
Stop losses are also an important consideration when trading head and shoulders pattern formations. Traders will often place stop losses just above the right shoulder in case the pattern is not confirmed and the price continues to rise.
It is important to note that technical analysts should wait for confirmation of the pattern before entering a trade. This confirmation typically occurs when the price breaks through the neckline with increased volume.
Limitations of Head and Shoulders Pattern Formation
One of the limitations of this type of pattern formation is the potential for false breakouts or whipsaws. This occurs when the price breaks through the neckline but then quickly reverses and continues to rise. Technical analysts need to be aware of this possibility and take it into consideration when making trading decisions.
It is also important to consider the market context when evaluating head and shoulders pattern formations. A pattern that occurs in a bullish market may not have the same significance as a pattern that occurs in a bearish market.
Conclusion
Technical analysis is an important tool for traders who rely on market statistics to make trading decisions. This type of formation is a useful chart pattern that technical analysts use to identify potential trading opportunities. It is important to understand the characteristics of the pattern, the importance of volume, and the need for confirmation before entering a trade.
Technical analysts should also be aware of the limitations of the pattern, including false breakouts and the importance of considering market context. Ultimately, by keeping a watchful eye on head and shoulders pattern formation, technical analysts can identify potential trading opportunities and make informed decisions.
Related Post:
The Best Forex Broker


