Bitcoin, the flagship cryptocurrency, has continued its remarkable journey in the financial markets. Over the past decade, it has gone from a niche digital asset to a global phenomenon. In this article, we will explore the latest BTCUSD trading analysis, focusing on the bullish momentum that continues to drive Bitcoin’s price higher.
Bullish Factors Propelling Bitcoin:
Institutional Adoption: One of the most significant factors fueling Bitcoin’s rise is the increasing interest and adoption by institutional investors. Companies like Tesla, Square, and MicroStrategy have allocated a portion of their balance sheets to Bitcoin, signaling confidence in its long-term value. This institutional influx has brought a sense of legitimacy to the cryptocurrency market, instilling trust and confidence among retail investors.
Scarcity: Bitcoin’s unique supply dynamics have always been a key driving force. With a capped supply of 21 million coins, Bitcoin offers a hedge against inflation and currency devaluation, attracting investors seeking to preserve their wealth in the face of economic uncertainty.
Global Economic Uncertainty: The ongoing global economic challenges, including the COVID-19 pandemic, have underscored the need for alternative assets. Bitcoin, often referred to as “digital gold,” has gained traction as a store of value, especially during times of economic turmoil.
Technical Analysis:
Technical analysis plays a vital role in understanding the short-term and long-term price movements of Bitcoin. Let’s delve into some key technical indicators:
Moving Averages: The 50-day and 200-day moving averages are widely followed indicators. A bullish crossover, where the 50-day moving average crosses above the 200-day moving average, is seen as a bullish sign. In the current analysis, this crossover has already occurred, indicating strong upward momentum.
Relative Strength Index (RSI): The RSI measures the strength and speed of a price movement. An RSI above 70 indicates an overbought condition, while an RSI below 30 suggests oversold conditions. In the current analysis, the RSI for BTCUSD remains in the bullish territory, indicating potential for further upward movement.
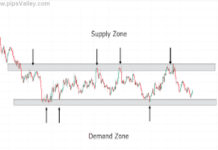
Support and Resistance Levels: Key support levels to watch are around $55,000 and $50,000, while notable resistance levels are at $65,000 and $70,000. A break above these resistance levels could signal a further bullish advance.
Conclusion:
The BTCUSD trading analysis clearly indicates that Bitcoin is on a bullish trajectory, driven by a convergence of institutional adoption, scarcity, and global economic uncertainty. While it’s important to remember that the cryptocurrency market can be highly volatile, the current analysis suggests that Bitcoin’s long-term growth potential remains strong.
Investors should exercise caution, conduct thorough research, and consider their risk tolerance before participating in the cryptocurrency market. As always, it’s advisable to consult with financial professionals or experts for tailored investment advice.
Related Post:
MACD Histogram and Ichimoku Indicator


