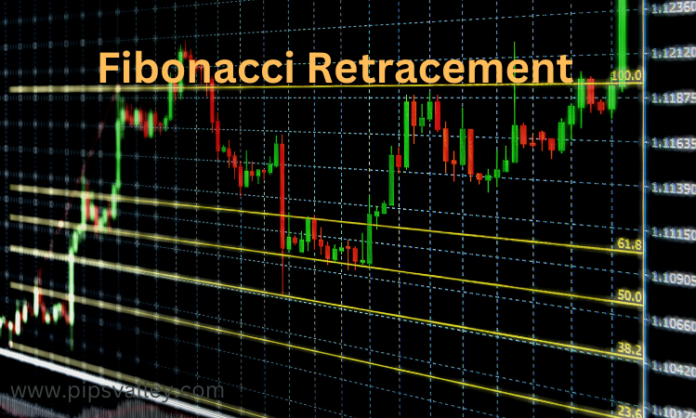
Fibonacci Retracement is a technical analysis tool that Fibonacci traders use to find potential support and resistance levels. The theory is that after a price moves in a particular direction, it will retrace or pullback to certain Fibonacci levels before continuing in the original direction. These Fibonacci levels are derived from the famous Fibonacci sequence and are popularly known as the 23.6%, 38.2%, 50% and 61.8% retracement levels.
Fibonacci retracement can be used in conjunction with other technical indicators to provide trade signals, identify potential support and resistance areas, or set stop-loss orders. In general, if the market is trending upwards, traders look for buying opportunities when prices pullback or retrace to key Fibonacci support levels. On the other hand, if prices are falling, traders may look for short selling opportunities when prices reach key Fibo retracement resistance levels.
The most important thing to remember about using fibo retracement is that they are not predictive; rathe , they simply help identify possible areas of support and resistance where price action might stall or reverse. As with any technical indicator, it is important to use fibo retracement in conjunction with other forms of analysis before making any trading decisions.
Related Articles:
Forex Trading Indicators and Top Five


