The financial markets are always influenced by a complex interplay of various factors, including supply and demand dynamics, investor sentiment, and overall market trends. Traders and investors utilize various technical indicators to assess the health of the market and make informed decisions.
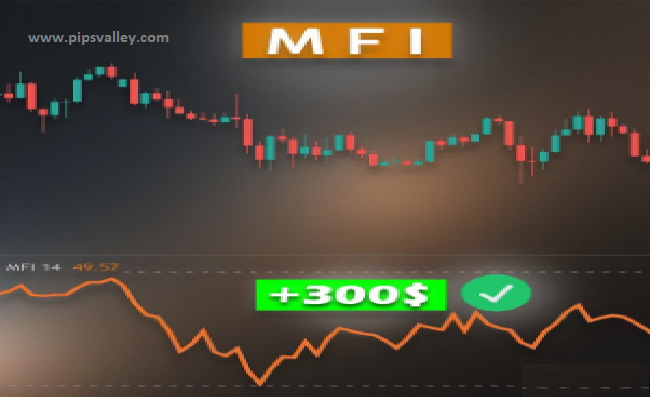
One such tool is the Money Flow Index (MFI), a popular indicator that measures the strength and direction of money flow in a particular asset or market. In recent analysis, the MFI has indicated increasing selling pressure, suggesting a potential bearish trend ahead.
Understanding the Money Flow Index (MFI)
The Money Flow Index is a momentum oscillator that measures the inflow and outflow of money into a security or market over a specific period. It combines price and volume data to provide insights into the strength and direction of money flow. The MFI ranges from 0 to 100 and is commonly used to identify overbought and oversold conditions, as well as potential trend reversals.
Interpreting the Increasing Selling Pressure
When the MFI shows increasing selling pressure, it indicates that more investors are selling a particular asset or security compared to those buying it. This surge in selling pressure suggests a shift in market sentiment towards a bearish outlook. It signifies a higher willingness of market participants to sell their positions, possibly due to concerns about the asset’s future performance or a desire to lock in profits.
The MFI calculates the ratio of positive money flow (buying pressure) to negative money flow (selling pressure) and generates a value between 0 and 100. A reading below 50 typically indicates selling pressure and a potential bearish trend, while a reading above 50 suggests buying pressure and a potential bullish trend.
Implications for Traders and Investors
For traders and investors, recognizing increasing selling pressure as indicated by the Money Flow Index can be crucial for making informed decisions. Here are a few implications to consider:
- Trend Reversal: The rising selling pressure revealed by the MFI suggests a potential reversal from a previously bullish trend. Traders who were riding the upward trend may consider adjusting their positions, tightening stop-loss orders, or even considering short-selling opportunities.
- Market Timing: The MFI can help investors time their entry or exit points in the market. With the emergence of selling pressure, it might be prudent to wait for signs of a reversal or a more favorable buying opportunity.
- Confirmation with Other Indicators: The MFI is most effective when used in conjunction with other technical indicators and analysis techniques. Traders and investors should consider cross-referencing the MFI’s signals with other indicators like moving averages, support and resistance levels, and trend lines to gain a comprehensive view of the market.
Conclusion
The Money Flow Index is a valuable tool for assessing the strength and direction of money flow in the market. By identifying increasing selling pressure, traders and investors can gain insights into a potential bearish trend ahead. However, it’s important to remember that no indicator is foolproof, and market conditions can change rapidly. Therefore, it is essential to conduct thorough research, apply risk management strategies, and seek professional advice when making investment decisions.
Related Post:
Forex Trading Indicator and Top Five


