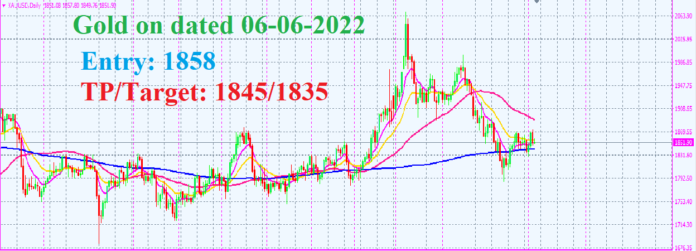
In forex trading, “lower low” and “lower high” are terms used to describe specific price patterns on a price chart. They are important concepts in technical analysis, which is a method of analyzing historical price data to make informed trading decisions. Let’s break down what each of these terms means:
Lower Low (LL):
A lower low refers to a price point on a chart where the price of a currency pair or asset is lower than the previous low. In other words, it signifies a decline in price momentum and suggests that sellers are exerting more pressure than buyers. Lower lows are often seen as bearish signals and may indicate a potential downtrend or continuation of an existing downtrend.
For example, if the EUR/USD currency pair reached a low of 1.1000, then retraced higher, but subsequently reached a new low of 1.0950, the second low at 1.0950 would be considered a lower low compared to the previous low at 1.1000.
Lower High (LH):
A lower high refers to a price point on a chart where the price of a currency pair or asset forms a peak that is lower than the previous high. This pattern suggests a weakening of buying momentum and can indicate the potential start or continuation of a downtrend.
For instance, if the GBP/JPY currency pair reached a high of 150.00, then retraced lower, and subsequently reached a new high of 149.50, the second high at 149.50 would be considered a lower high compared to the previous high at 150.00.
The combination of lower low and lower high is often associated with a downtrend. Traders may use these patterns as part of their trading strategies to identify potential entry points for short (sell) positions or as confirmation signals for existing bearish positions. However, it’s essential to use these patterns in conjunction with other technical indicators and analysis methods to make well-informed trading decisions, as no single pattern or signal is foolproof, and the forex market can be highly volatile and unpredictable.
Always consider risk management techniques, such as setting stop-loss orders, when trading based on technical analysis patterns like lower lows and lower highs to protect your capital from significant losses.
Related Post:
Trendline as Indicator


